Special Colors and Optical Effects of Oregon Sunstone: Absorption, Scattering, Pleochroism, and Color Zoning

ABSTRACT
Oregon sunstone is a unique feldspar gemstone that displays a wide range of colors and optical effects due to the presence of metallic copper inclusions of various sizes and shapes. Most striking are the distinct green and red colors caused by copper particles, sometimes with strong red to green pleochroism. Recent computation work suggests that copper particles can strongly absorb and/or scatter light depending on the relative orientations of the feldspar crystal, the copper particles, and the polarization of the incident light, resulting in dramatically different appearances of the same crystal when viewed (or cut) along different directions. Common optical properties of Oregon sunstone are described and explained in detail in this paper, based on the optical theories of metallic nanoparticles in anisotropic media. Notably, it was found that the red to green colors observed can only be explained by considering both selective absorption and scattering from copper particles. The absorption and extinction spectra of the copper inclusions in Oregon sunstone are measured for different crystal orientations and polarizations. The scattering effect of the copper particles is quantified by subtracting absorption from extinction, the result of which agrees closely with the computed optical properties of spheroidal copper nanoparticles. The orientation of the anisotropic copper particles relative to the optical indicatrix of the feldspar is described. The correlation between the copper concentration profile and the “watermelon” color zoning in some Oregon sunstones is examined and discussed, along with a comparison to the color zones in treated, copper-diffused feldspar. Further studies on the diffusion and dissolution mechanisms of copper in feldspar crystals are required to fully understand the geologic processes that create these special gemstones in nature, which may provide additional methods to differentiate between treated and untreated stones.
Oregon sunstone is a significant feldspar gemstone with growing popularity, and certainly one of the most famous gemstones produced in the United States. Found in weathered lava flows, these basaltic phenocrysts have poorly developed cleavages and few inclusions or twins due to the disordered structure resulting from a fast cooling rate (Xu et al., 2017; Jin et al., 2018, 2019), making them more suitable for faceting than other feldspar gemstones. Their popularity comes mainly from the wide range of appealing colors (figure 1), from the more common yellow, pink, orange, and red to the extremely rare green-blue (www.oregonsunstoneguide.com/types-and-colors.html). Many of these colors have not been found in feldspar from anywhere else in the world. The term sunstone was originally defined (Andersen, 1915) as the gem variety of aventurine feldspar, showing intense play of light and colors caused by strong reflections from thin oriented metallic inclusions of visible sizes, a phenomenon known as aventurescence. The loosely defined word schiller is more commonly used to describe the aventurescence of sunstones in the gem community (the two terms are used interchangeably in this article). Most sunstones, such as those from India, Norway, and Tanzania, owe their aventurescence effect to hematite inclusions. Copper-containing aventurine feldspar was first documented by Andersen (1917), who studied specimens reportedly from Modoc County, California. This county borders southern Oregon, an area hosting many deposits known to produce gem-quality copper-included feldspars. Although many of the gem feldspars from Oregon that display red to bluish green colors do not technically fit the definition of “sunstone” due to their lack of reflective visible-sized inclusions, these copper-bearing gem feldspars from Oregon are all known as “Oregon sunstone” in the gem trade.
Copper inclusions in non-gem feldspar, though extremely rare, have been reported from localities such as Miyake-Jima in Japan and the Pinacate volcanic field in Mexico (Rossman, 2011). Oregon is the only verified occurrence of gem-quality copper-bearing sunstone. Similar gem materials have been reported from Ethiopia, though the deposit has not been independently verified (Kiefert et al., 2019; Sun et al., 2020). Moreover, copper has been shown to easily diffuse into feldspar, which can create rich red colors in originally colorless or light yellow crystals (Emmett and Douthit, 2009; Zhou et al., 2021, 2022). This discovery was made after a large quantity of red feldspar purportedly from Asia (Tibet) or Africa (Democratic Republic of the Congo) flooded the gem market, sparking controversy regarding the origin and authenticity of these gemstones (Rossman, 2011; Abduriyim et al., 2011). Major and trace element compositions can be used to separate copper-bearing feldspar from different geological origins (Sun et al., 2020), and argon isotope analysis has been used to test high-temperature treatment (Rossman, 2011). The diffused feldspars have much higher copper concentrations than natural Oregon sunstones of similar color intensities (Sun et al., 2020; Jin et al., 2022) and often show unnatural zoning patterns (McClure, 2009). While natural Oregon sunstone is straightforward to identify, there is not yet a simple and definitive way to confirm artificial copper diffusion in feldspar.
The aventurescence effect in Oregon sunstone is obviously created by the copper flakes oriented along the cleavage planes of the feldspar crystals, as they can be observed optically under the microscope (or even with the unaided eye). The origin of the bodycolor observed in some Oregon sunstone, on the other hand, is less obvious. Although the correlation between the special colors and the copper content is unmistakable, the exact mechanism by which copper can create these various colors had been elusive. Hofmeister and Rossman (1985) first studied the origin of color in relationship to the copper content and copper species in Oregon sunstone. They found that the red color in Oregon sunstone is the same as the color in red glass colored by copper/gold (“copper ruby glass”), both of which are caused by the optical properties of metallic copper colloids. In fact, copper and gold nanoparticles have been used to produce red glass for centuries, long before the physics and chemistry behind it was understood (Nakai et al., 1999; Freestone et al., 2007; Ruivo et al., 2008). The more desired green-blue colors of Oregon sunstone are much more puzzling, because no nanoparticle-colored glass counterpart with similar colors has been manufactured. Hofmeister and Rossman (1983) first hypothesized that anisotropic colloids could be causing the strong pleochroism often observed in green-blue Oregon sunstones, later supported by the observed correlation between the copper particle orientation and the color change (Farfan and Xu, 2008), as well as the direct transmission electron microscopy (TEM) observation of anisotropic copper nanoparticles (Wang et al., 2019).
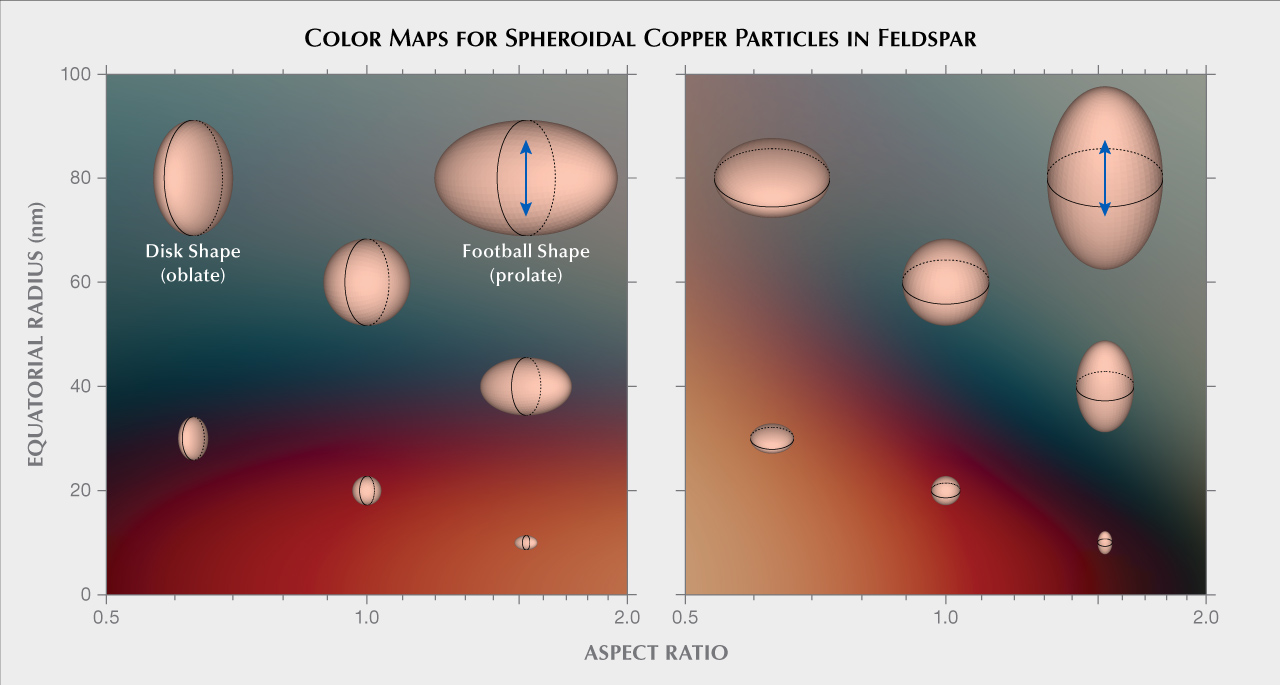
A recent study computed the optical properties of spheroidal copper particles of various sizes and shapes embedded in feldspar, using methods based on simplified solutions of Maxwell’s equations (Jin et al., 2022). The results explained the colors and pleochroism observed in both natural and treated copper-bearing sunstones. Smaller copper particles mainly absorb blue and green light, which can create a vivid red color. Slightly larger particles strongly scatter red and orange light to allow more green and blue light to pass directly through the crystal. Intense pleochroism can be created when elongated particles are aligned in the same direction, with the absorption and scattering much stronger when the polarization of the incident light is along the longer direction of the particles. A color map based on the computational results from Jin et al. (2022) is provided in figure 2, showing a rather dramatic change from red to green with increasing particle size and aspect ratio (the ratio between the long dimension and the short dimension of the particle). The copper nanoparticles absorb and scatter light so effectively that only a small amount (~20 ppmw) of exsolved metallic copper can produce saturated colors in mostly transparent crystals. Thicker crystals with denser numbers of copper particles would quickly turn opaque, allowing only the red backscattered light to be observed. Optical effects present in copper-bearing feldspar can be further complicated by the crystal’s low triclinic symmetry, resulting in complicated interactions between the light absorption/scattering by nanoparticles and the optical anisotropy of the matrix, the combination of which has not been studied in detail before. Given this newly published research about the optical properties of the copper particles, we revisit the colors and optical effects of Oregon sunstone in order to provide a comprehensive explanation of the special properties of this unique gemstone.
MATERIALS AND METHODS
The provenance, composition, copper concentration, and color of the seven samples studied in this paper are listed table 1. The chemical compositions and copper concentrations of the samples were analyzed with a laser ablation–inductively coupled plasma–mass spectrometer (LA-ICP-MS), consisting of a Thermo Scientific iCAP Qc ICP-MS connected to an Elemental Scientific Lasers NWR213 laser ablation system (frequency-quintupled Nd:YAG laser operated in Q-switched mode at a wavelength of 213 nm and pulse duration of 4 ns). Standard glasses GSD-1G, GSE-1G, and NIST SRM 610 were used for external calibration. All samples were analyzed on a traverse from edge to edge through the center of the crystal, with a 55 μm diameter laser beam size at a 20 Hz repetition rate and a fluence (energy density) of ~12 J/cm2. No obvious zoning of the major elements was observed; therefore, only the average composition is reported. The copper concentration showed various zonation and is listed as a range in table 1.

All the samples were fabricated into wafers (not optically oriented) with at least two parallel polished surfaces for imaging and spectrometry analyses. The extinction spectra were collected on a PerkinElmer Lambda 950 ultraviolet/visible (UV-Vis) spectrometer, whereas the absorption spectra were collected with a GIA UV-Vis spectrometer, which is constructed from an AvaSphere-50 integrating sphere, an AvaLight-DS deuterium light source, and a QE Pro high-performance spectrometer. Custom-blended Laser Liquid from Cargille with a refractive index of 1.540 was used as an index-matching (immersion) liquid for orienting the feldspar crystals and measuring extinction spectra in different directions.
ABSORPTION AND SCATTERING BY COPPER PARTICLES
The feldspars containing copper inclusions are either colloids or suspensions, in which the copper particles are dispersed inside the feldspar host as a separate phase (see box A). The copper particles larger than a few micrometers in size (copper suspension) are almost all aligned along the cleavage planes of the feldspar host, which means their shiny surfaces would reflect light simultaneously to create the schiller effect. However, if the copper particles are smaller than a couple hundred nanometers in size (copper colloid), they cannot be directly resolved optically. The copper nanoparticles, unlike the larger inclusions with flaky shapes, are mostly spherical or spheroidal, as directly observed by TEM (Wang et al., 2019). This is because the system always tries to minimize the excessive interfacial energy by reducing the surface area of the nanoparticles. The smaller the particle size, the larger the relative surface area (surface area per unit mass/volume) and the closer the particle shape is to a sphere. The anisotropy of the interfacial energy (with the anisotropic feldspar host) may distort the nanoparticles to spheroid or ellipsoid shapes.
BOX A: DISPERSION SYSTEMS AND THEIR OPTICAL PROPERTIES |
|
Due to the second law of thermodynamics, everything in nature is a mixture of multiple components, resulting from the tendency to maximize entropy. Even the purest material created by humans, single-crystal silicon for making computer chips, contains a few impure atoms for every trillion silicon atoms. It is simply impossible to make anything 100% pure. Most of the mixtures are systems known as dispersions, in which distributed particles of one material are dispersed in a continuous phase of another material. The two materials mixed in the dispersion system can be in identical or different states of matter (gas, liquid, or solid). The dispersions can be divided into three different categories (solution, colloid, and suspension) with very distinct optical properties, separated by the sizes of the dispersed particles. 
Figure A-1. Diagram showing light interaction with dispersion systems of different particle sizes. Only the particles in a suspension are large enough to be visually observed. When a beam of light is shining from the side, no visible effect can be observed in a solution, but an illuminated path of light can be seen in a colloid and a suspension due to the scattering effect by the dispersed particles.
In a solution, the dispersed particles are at the atomic scale, resulting in a thermodynamically stable homogenous system with one single phase. Common examples of solutions are air, an alcoholic beverage, seawater, and metal alloys. Most allochromatic gemstones (sapphire, ruby, emerald, and alexandrite) are solid solutions with trace amounts of color-absorbing ions (e.g., chromium, iron, or titanium) or point defects (vacancies) evenly dissolved in the crystal lattice of the gem mineral. Solutions almost exclusively absorb light through electron transitions (excitation) involving the dissolved ions and molecules, which can result in a color for the transmitted light (with back lighting or internal reflection in the case of faceted stones). When light is shining from the side (perpendicular to the viewing direction), the light beam is invisible inside the solution (figure A-1) because no light is deflected to the observer by the solution. Although Rayleigh and Raman scattering is theoretically possible in a solution, these effects are so weak that they cannot be observed unless on an extremely large scale (for example, Rayleigh scattering by the atmosphere causes the sky to appear blue). In a suspension, the dispersed particles are at the micrometer scale or larger and optically visible (either under an optical microscope or without magnification). Suspensions are unstable heterogeneous mixtures, from which the suspended particles will settle out of the (fluid) mixture if left undisturbed for a prolonged period. Common examples of suspensions include muddy water, sandstorms, and lava flow. Minerals and gemstones with eye-visible inclusions are also suspensions, such as aventurine feldspar, rutilated quartz, “horsetail” demantoid, and star sapphire. The larger particles in suspension behave similarly to bulk macroscopic objects, which reflect and absorb light rays mostly on their surfaces. Depending on the particle density, a light beam shining from the side can be outlined by the illumined particles in the suspension, if not completely blocked by the dense particles (figure A-1). 
Figure A-2. Sample A110, a copper-diffused feldspar from China, under darkfield (left) and brightfield (right) illumination. The deep red color on the left is the color of the light scattered by the copper nanoparticles (Tyndall effect). The colors on the right are from the light transmitted through the crystal (neither absorbed nor scattered). The red zone on the left perfectly matches the green zone on the right, whereas the red rim on the right is almost invisible on the left. This means the green color is mainly produced by the scattering of red light, while the red color is mostly from the absorption of the copper particles. Photos by Shiyun Jin; field of view 7.1 mm.
A colloid is a dispersion with particle sizes in between those of solutions and suspensions. The particles in a colloid are smaller than a couple hundred nanometers, which is below the resolution of optical microscopy and cannot be directly observed using any optical device. However, the colloidal particles (also called nanoparticles) are much larger than atoms and small molecules, and they can strongly scatter light in all directions (Mie scattering). Therefore, the light path in a colloid is illuminated by the uniform scattering from the invisible particles, known as the Tyndall effect (figures A-1 and A-2, left). A colloid is a metastable heterogeneous system, meaning the particles will not settle out when left undisturbed, but it can easily be destabilized if the particles’ surface properties are altered (e.g., by adding an electrolyte in the host phase). Common examples of colloids are clouds, smoke, milk, ink, and cranberry glass (red glass colored by copper/gold). Colloid gemstones (those containing colloid particles, such as cloudy sapphire, fancy white diamond, and opal) often appear translucent due to the scattering particles. The metallic copper colloid in red copper-bearing feldspar has stronger absorption and weaker scattering than dielectric colloid particles, thus showing a solution-like appearance similar to other colored stones (note that the red rim in figure A-2, right, is almost invisible in figure A-2, left). The color of a colloid is also more complicated because the color from the scattered light and the transmitted light are often complementary to each other, making the observed color highly dependent on the type of illumination (back lighting, darkfield illumination, fiber-optic lighting) and the viewing direction. When light travels through an absorbing solution, its intensity is absorbed following the Beer-Lambert law, with the absorbance (Abs ) proportional to the path length in the medium (l ), the molar absorption coefficient (ε ), and the concentration (c ) of the absorber: 
in which the absorbance is defined as the negative logarithm of transmittance (T ), where T is the fraction of unabsorbed light intensity, I0 is the incident light intensity, and IA is the absorbed light intensity: 
In a scattering (non-absorbing) medium (colloid or suspension), the scatterance1 (Sca ) can be defined in the same way using scattered intensity (Is): 
For a medium that both absorbs and scatters light, the total effect of absorption and scattering is called extinction (Ext, or attenuation), for which the quantity of extinctance can be defined following the Beer-Lambert law: 
Note that transmittance (T ) is the quantity that can be easily measured, which means extinctance is the most directly analyzed. In non-scattering solutions, which is the case for most colored gemstones, extinctance is the same as absorbance. The scattering effect, on the other hand, is much harder to measure directly, which requires specially designed instruments (e.g., Sullivan and Twardowski, 2009) and has only been successfully done on liquid suspensions (e.g., seawater) and jet streams of small particles. Fortunately, the absorbance of a scattering medium, though not as easy to measure as extinctance, can be measured using an integrating sphere (Elterman, 1970; Fry et al., 1992; Nelson and Prézelin, 1993; Mignani et al., 2009), which blends the scattered light together with the transmitted light. Therefore, scatterance is best quantified by subtracting absorbance from extinctance.
1This term (along with “extinctance” in the next paragraph) is uncommon because there are very few studies on the scattering properties of nanoparticles. |

The interaction between light and copper nanoparticles is quite complicated. The free electrons in metallic copper—what make copper a very good conductor of heat and electricity—are pushed back and forth from one end of the particle to the other by the incident light (oscillation of the electric and magnetic field) at extremely high frequencies (the frequency of visible light is ~400–800 terahertz, or 4–8 × 10¹⁴ cycles per second) (figure 3A). Therefore, the free electrons in the copper particles can absorb the energy from incident light and transform it into heat (kinetic energy of the electrons). This absorption is the strongest when the frequency of the light coincides with the intrinsic frequency of the free electrons—an effect known as localized surface plasmon resonance (LSPR) (Petryayeva and Krull, 2011)—creating a peak in the UV-Vis absorption spectrum that is strongly dependent on the size and shape of the copper particle. The oscillating free electrons constrained by the particle boundary create hot spots of electric field on the surface of the nanoparticle, which would enhance the scattering power of the copper particles. Particles much smaller than the wavelength of the incident light behave as oscillating electric dipoles, whereas larger particles that extend more than one spatial period of the incident light show more complicated multipole behavior (figure 3). The oscillating electrons also emit light (at the same frequency as the incident light) that contributes to the light scattered by the copper particle. The metal nanoparticles are sometimes referred to as “optical nano-antennas” due to their electromagnetic resonating properties (He et al., 2009), and the strongly concentrated electromagnetic field (at the particle surface) is often used to enhance signals from a small region in spectroscopic analyses such as Raman spectroscopy (Hossain et al., 2009) or laser-induced breakdown spectroscopy (LIBS) (Palásti et al., 2020).

The extinctance of the copper particles in Oregon sunstone can be measured easily using a regular UV-Vis spectrometer by comparing the intensity of the attenuated light (transmitted through the medium) to the unattenuated intensity (directly from light source to detector) (figure 4A). However, the extinctance measured this way is not the same as absorbance, but the sum of absorbance and scatterance. The true absorbance needs to be measured inside an integrating sphere, with the detector positioned away from the direct path of the incident light (figure 4B). An integrating sphere is an optical device consisting of a hollow spherical cavity with its interior covered with a diffusely reflective coating. Light entering the integrating sphere is reflected and scattered multiple times before leaving through another port not in line with the incident light, which preserves the power of the light but destroys any directional or spatial information. When a scattering material is placed inside an integrating sphere, both the transmitted light and scattered light are blended together before entering the detector (figure 4B), which means the measured extinction (by comparing the detected intensity with and without the scattering crystal) is only due to the absorption of the crystal. It should be noted that, unlike the direct path configuration (figure 4A), light in the integrating sphere can be absorbed multiple times by the crystal itself, which may result in a higher absorbance depending on the relative size of the crystal to the integrating sphere. To minimize these errors, the integrating sphere used for optical measurement should be much larger than the measured sample. The to-scale illustration of the setup used in this study is shown in figure 4C. Once the total extinctance and absorbance are measured, scatterance of the copper particles in Oregon sunstone can be calculated by subtracting absorbance from extinctance.

The extinction spectrum (Ext, measured using the configuration in figure 4A) and absorption spectrum (Abs, see figures 4B and 4C) of sample SCH-001 are shown in figure 5. Because the micron-scaled copper inclusions in the schiller sunstone are large enough to block visible light of all wavelengths evenly, the extinction spectrum has a shape similar to a copper-free feldspar but elevated along the vertical axis. Because almost all the flaky copper inclusions are oriented in the same direction, the reflectance (backscattering) spectrum can also be directly measured. The measured reflectance spectrum (Ref ) is the same as bulk copper metal (as expected), which accounts for most of the scattering by the copper inclusions. Therefore, the scattering spectrum (Sca ) obtained from subtracting the absorbance from extinctance has a shape similar to the reflectance spectrum of copper, with red and orange light (>570 nm) preferably reflected (scattered) and blue/green light (<570 nm) absorbed. Note that reflectance is the intensity ratio (in percentage) between the reflected light and the incident light, whereas scatterance (by subtracting absorption from extinction) is the logarithm of the intensity ratio, which is why they cannot be plotted on the same scale and have slightly different shapes.

The absorption and scattering spectra of colloidal copper particles in feldspar can also be measured this way. As shown by the computational results from Jin et al. (2022), strong pleochroism can be created by elongated copper nanoparticles aligned in the same direction. To measure the scattering power with different polarization, a film polarizer is placed between the fiber-optic light and the feldspar crystal (again, see figure 4C). The experimentally measured spectra (figure 6) of two pleochroic copper-sunstone samples—sample A110 (treated) and sample SB-001 (natural)—match the computational result well. The red color is almost exclusively from absorption, with minimum scattering (extinction is almost the same as absorption in figure 6, A and C), whereas the green color gets significant contribution from the scattering of red light (λ >600 nm) (figure 6, B and D). Note that the absorption spectrum for the polarization direction in which the sample appears green (figure 6B) is very similar to that corresponding to the polarization direction in which the sample appears red (figure 6A), with an LSPR peak at ~570 nm followed by a drop-off (less steep in figure 6B than in 6A), which is characteristic of particles with a radius of ~35 nm and an aspect ratio of ~1.3 (Jin et al., 2022). Sample SB-001, on the other hand, shows an absorption peak at 600 nm that is enhanced by the scattering peak at 625 nm, adding up to an exceptionally strong peak in the extinction spectra at 613 nm (figure 6D). This indicates a smaller particle radius (~20 nm) with a higher aspect ratio (~1.7) (Jin et al., 2022).
PLEOCHROISM OF OREGON SUNSTONE
As shown by the computational results from Jin et al. (2022), a higher aspect ratio of the copper or other metal nanoparticles produces stronger pleochroism2. In an optically isotropic medium such as glass, the transmittance (T ) of light polarized at an angle of θ relative to the longer direction of the copper particles (assuming they are all oriented vertically) is an average of vertical (long direction of the particle, l ) and horizontal (short direction of the particle, s) transmittance (figure 7A):

2The scattering effect is not considered in this section. Therefore, only terms related to absorption are used for simplicity, even though it is extinction being measured in the experiments.

This is because the vertical and horizontal components of the incident light are absorbed independently by the particle. Therefore, the absorbance (A) as a function of angle θ (figure 7, A and B) is:

But in an optically anisotropic medium, the pleochroism (maximum and minimum absorption) for a certain orientation is determined by the optical orientation of the host crystal (feldspar in the case of Oregon sunstone) instead of the orientation of the light absorber (copper particles) (Libowitzky and Rossman, 1996). Light inside an anisotropic crystal is split into two perpendicularly polarized light rays following the directions of maximum/minimum refractive index (n1 /n2) (the dashed arrows in figure 7C), which are absorbed (attenuated) independently. The absorbance is thus dependent on the angle α (between polarization direction and n2) instead of θ (figure 7, C and D):

The absorbance A1 and A2 (along n1 and n2), on the other hand, are determined by the angle β between the long dimension of copper particles and n2 (figure 7C):


Note that absorbance is used in equations 4 and 5 rather than transmittance, as seen in equation 1. This is because the two polarized rays inside the crystal (corresponding to n1 /n2) are constrained by the optical anisotropy of the medium and cannot be further decomposed. (The assertion by Sambridge et al. [2008] that absorbance can be simply replaced by transmittance in all equations is incorrect, as transmittance is used if and only if there are multiple rays or components being attenuated independently.) Combining equations 3, 4, and 5 results in:

The orientation of the copper particles cannot be directly extracted from the angular absorption figures, as it is masked by the optical anisotropy of the feldspar. It also means the pleochroism of an anisotropic crystal is generally smaller than the anisotropy of the absorber (figure 7, B and D). The angle β determines the shape of the angular absorption figure but does not change its orientation. (To view how the angular absorption figure changes with β, see videos 1 and 2.)
The “absorption ellipsoid” (Dowty, 1978; Sambridge et al., 2008) of a triclinic crystal is completely independent from its optical indicatrix, because there is no symmetrical constraint on either of them by the crystal structure. Although the optical indicatrix can be easily determined, the orientation of the absorber (absorption ellipsoid) cannot be independently measured due to the splitting and polarization of light rays inside the crystal (figure 7, C and D). In theory, the orientation of an anisotropic absorber in a triclinic medium can be determined by reconstructing the absorbance ellipsoid from the absorption coefficient of six independent directions (Dowty, 1978). In practice, however, such reconstruction is very difficult (if not impossible), as it requires complete deconvolution of the absorption spectra into independent absorption bands with accurate baseline corrections. Therefore, the absorber orientation (absorption ellipsoid) has never been quantified for any triclinic crystals. Moreover, the absorption spectra of copper particles cannot be simplified as combinations of several independent bands with fixed peak widths and positions, because the absorption/scattering peak continuously changes with different particle sizes and shapes. Nonetheless, it is still possible to determine the orientation of the copper particles in a strongly pleochroic Oregon sunstone, as the intense absorption peak at ~600–630 nm only occurs when light is polarized along (or at a slight angle with) the long direction of these particles.

The optical orientation (principal axes X, Y, and Z of the optical indicatrix) of the feldspar crystal needs to be determined first, because the polarized absorption spectrum is only meaningful when measured along special optical directions. This can be achieved by locating the two optic axes using an optical orienting device (Thomas et al., 2014). The Y-axis is perpendicular to the optical plane (a plane containing two optic axes), whereas the X- and Z-axes are the bisectors of the two optic axes. Sample SB-001 mounted on a dop along the Z-axis of the optical indicatrix (with the X-axis facing downward) is shown in figure 8A, along with the relative orientation between the optical indicatrix (white ellipsoid) and the crystallographic axes of the feldspar (figure 8, C and D). The orientation of the optical indicatrix agrees with the composition following the stereographic plot by Smith and Brown (1988, p. 200). Similar to most Oregon sunstone crystals, sample SB-001 is tabular shaped, with the table face parallel to the (010) cleavage/twin plane (Stewart et al., 1966). The (001) cleavage is relatively poorly developed but still recognizable on one side of the crystal (figure 8A). Note that even with the two cleavage planes (010) and (001) correctly identified, though they are not always obvious, the direction of the a-axis still cannot be unambiguously determined (there are two possibilities for positive and negative direction) without any developed crystal faces (other than the cleavages). Without using X-ray diffraction, measuring the optical orientation of the crystal is necessary to determine its crystallographic axes.

When the polarization plane of the incident light (red plane in figure 9A) is perpendicular to the X-axis (vertical blue line), the polarization will remain unchanged inside the crystal (immersed in an index-matching liquid to avoid irregular surface refraction). This property allows the absorbance to be measured along any direction perpendicular to the X-axis. Here we define the longest axis of the copper particles as P (black line in figure 9A), the angle between P and the X-axis as γ, and the angle between the P-X plane (yellow plane) and the plane normal to the incident light (green plane) as φ. As the crystal is rotated around the X-axis (perpendicular to the polarization plane), the projection of the copper particle along the horizontal direction (polarization direction marked as red arrow in figure 9B) is dependent on the angle φ, which is maximized at φ = 0° and minimized at φ = 90°. (To view the full rotation around the X-axis, along with the corresponding particle projection, see video 3.) The color change during the rotation is more dramatic when P is closer to the horizontal plane (γ angle closer to 90°). The images in figures 9C and 9D show the two extreme colors (green at φ ≈ 0° and red at φ ≈ 90°) during the rotation around the X-axis under horizontally polarized light (to see the color change during the full rotation, see video 4). The P-X plane can thus be determined by the position of maximum (φ = 0°) and minimum (φ = 90°) absorption. The same measurement can be performed by rotation around the Z-axis to determine the P-Z plane, and the orientation of the copper particles P can be determined as the intersection of the P-X and P-Z planes. It should be noted that measurement with rotation around the Y-axis should be avoided because incident light at a slight angle with the optic axis may result in incompletely polarized rays and irregular refraction (Sambridge et al., 2008).


The absorption spectra of sample SB-001 with polarization perpendicular and parallel to the X-axis (at three different angles between the incident direction and the Z-axis) are shown in figure 10, measured using the same configuration in figures 9C and 9D. The maximum and minimum absorption occur when the incident light is at an angle of 6(±3)° and 96(±3)° with the Z-axis, indicating the P-X plane (red plane in figure 11) is at an angle of ~6° with the X-Y plane (~96° with the X-Z optical plane). Note that the spectra with polarization parallel to the X-axis barely change with rotation of the crystal; this is expected because the projection of the copper particles along the vertical direction does not change during rotation of the crystal (figure 9B and video 3). It should also be noted that the minimum absorption spectrum in figure 10A (96°) does not show any shoulders at ~610 nm, agreeing with the computational results by Jin et al. (2022). This indicates that the shoulder of the absorption spectrum in figure 6C is contributed by the long direction of the copper particles (Al ) resulting from a small β angle in equation 6. The spectrum under vertical polarization is also very similar to the 6° spectrum under horizontal polarization (figure 10A), indicating the γ angle (figure 9A) between P and X is close to 45° (β = γ when φ = 0°). Performing the same measurements around the Z-axis results in an angle of ~135° between the P-Z (blue plane in figure 11) and X-Z planes. The intersection of the P-X and P-Z planes aligns well with the a-axis of the feldspar crystal (figure 11). This makes sense because the (010) and (001) cleavage planes have the weakest connections (chemical bonds) in the feldspar structure, which means the copper particles encounter the least resistance when growing along the intersection of these two planes (a-axis). It is also possible that a faster copper diffusion rate along the a-axis contributes to the particle elongation. As the particles get larger, one of the cleavage planes dominates the growth, resulting in flaky inclusions that create the schiller effect (figure 5).

If the crystal is viewed along P (see figure 9A), which has the smallest projection of the copper particles, only red color would be observed (no pleochroism) because the absorption is always minimal no matter the polarization of the incident light. On the other hand, viewing perpendicular to P does not guarantee maximum absorption or pleochroism because the polarization of light inside the crystal is controlled by the optical anisotropy of the feldspar matrix (figure 7). The maximum pleochroism occurs only when the polarization of light inside the feldspar crystal is perfectly parallel or perpendicular to P (β = 0°/90° in equation 6 and figure 7C). This special optical direction can be found easily by total optical extinction between crossed polarizers, because the incident light (horizontal plane in figure 12A) polarized perpendicular to P would be completely extinguished by the analyzer (gray plane in figure 12A, with vertical polarization parallel to P) after the crystal only when the elliptical optical section is aligned with P. Images of sample SB-001 mounted on a dop along the a-axis (particle orientation P) between cross polarizers at two different positions are shown in figure 12, B and C, along with the schematic relations between the particle orientation and the optical sections. (To view the crystal going in and out of complete extinction during the full rotation, see video 5.) The orientation of the optical section that creates complete extinction in figure 12D is marked as the cyan plane in figure 11A, which is at an angle of ~30° with the (010) cleavage. This is the orientation with the strongest pleochroism, as shown by the polarized extinction spectra in figure 12D. This method can be used to maximize (or minimize) the pleochroism while faceting Oregon sunstone crystals, as the copper particles should mostly elongate along the a-axis (the easiest direction to identify in a rough feldspar crystal), even though the exact orientation of the section with maximum pleochroism may vary depending on the composition of the feldspar.
COLOR ZONING IN OREGON SUNSTONE
Another special feature commonly observed in Oregon sunstone is color zoning. Unlike most colored stones, in which the color intensity is directly proportional to chromophore concentration, the colors and color intensities of copper feldspars are strongly dependent on the density, size, and shape of the copper particles (Jin et al., 2022), which are not simply correlated with the concentration of copper in the crystal. The treated (copper-diffused) feldspars from China (e.g., sample A110) contain much more copper than natural Oregon sunstone of similar (if not stronger) colors (table 1) (Jin et al., 2022). This means the color zoning in Oregon sunstone, controlled by multiple factors (copper concentration, defects, temperature/cooling rate, and oxygen fugacity), is much more complicated than the zoning in other gemstones.

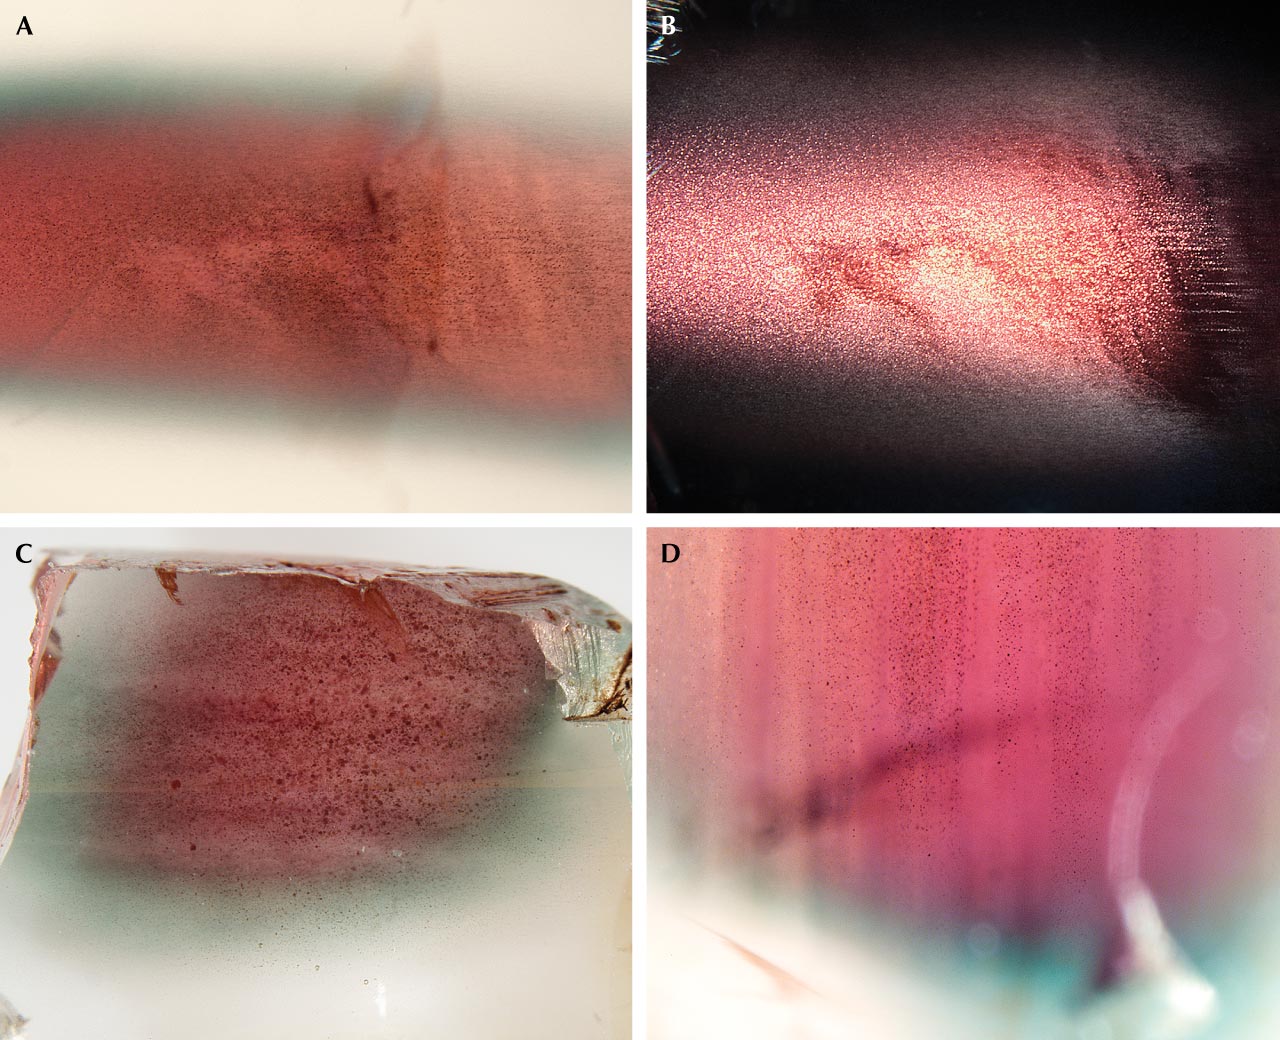
The most recognizable zoning pattern of Oregon sunstone is the “watermelon” color, with a red-colored core followed by a thin green-colored (pleochroic) rim, before turning near-colorless close to the surface of the crystal. Images of Oregon sunstone crystals with typical “watermelon” colors under transmitted light (brightfield illumination) are shown in figure 13. The color zones in Oregon sunstone have smooth transitions and curved boundaries (e.g., Rossman, 2011; Xu et al., 2017), with the shape roughly following the irregular shape of the feldspar crystal (or cracks inside the crystal; e.g., sample A319 in figure 13). The colorless zone near the surface of the crystal is often wider than the colored zone.
The color zoning in almost all other gemstones, such as ametrine or “watermelon” tourmaline, is a direct reflection of the changes in chemical composition (chromophore concentration) of the crystal across the different zones, which are controlled by either the conditions (chemistry, temperature, pressure) during crystal growth (i.e., growth zoning), or the crystal chemistry of the zoned mineral itself (i.e., sector zoning). The light-absorbing elements (e.g., iron, titanium, chromium, vanadium, or manganese) typically diffuse very slowly in crystals, and thus any abrupt changes in their concentrations (sharp color zone boundaries) can only be created during crystal growth. Gradual changes in the chemistry of the fluid that feeds the crystal growth would create the smooth color changes that are often observed in some elongated crystals (e.g., bicolor tourmaline). Slow diffusion of the chromophores after crystallization can gradually smooth out some of the initially sharp boundaries over thousands or millions of years in certain geological settings, which is often used to estimate the cooling rate or annealing time of chemically zoned minerals. Whether sharp or smooth, the color zoning in gemstones other than Oregon sunstone almost always follows the crystal habit of the mineral (i.e., concentric/radial hexagonal zones with sharp corners or along the c-axis in elongated crystal form).

The unique zoning characteristics of Oregon sunstone are clearly not growth controlled, with no correlation to the common crystal habit of feldspar. Copper has been shown to diffuse in feldspar extraordinarily rapidly (Emmett and Douthit, 2009; Audétat et al., 2018; Zhou et al., 2021, 2022), which means the concentration profile of copper in feldspar may change noticeably within weeks or even days at magmatic temperatures. The “watermelon”-colored Oregon sunstones have most of their copper near the core of the crystal and almost no copper at the surface, as shown by the LA-ICP-MS analysis results for sample A314 in figure 14. However, the color zoning appears to contradict the copper concentration profile, as the red color corresponds to a smaller copper particle size than the green color, as shown in figure 2. This apparent anomaly can be resolved with a closer look at the “watermelon”-colored Oregon sunstone, revealing the larger micron-scaled particles with schiller effect in the red-colored cores (figure 15). The copper would precipitate first at the core of the crystal with higher copper concentrations, which had longer growth time to form larger particles than the zones closer to the surface with lower copper concentrations. Most of the copper particles in the green zone stopped growing at intermediate sizes (~100 nm in diameter) before they became large enough to produce schiller. Smaller particles that produce a red color (<80 nm in diameter) would precipitate at a later stage, presumably due to further cooling. The larger particles with schiller effect have a flat extinction spectrum (figure 5) and therefore cannot mask the red color from the small particles in transmitted light. The intermediate particles that generate a green color, on the other hand, have the strongest extinction power (Jin et al., 2022) and would overshadow the red color from any small particles (figures 6, 11, and 13). The copper profile (figure 14) in the artificially diffused sample A110 (figure A-2), in contrast, is mostly flat with dips near the very edge, showing no obvious correlation between the color zones and copper concentration.

Copper could partition into the feldspar phenocrysts during their growth from the basaltic magma at depth. It has been hypothesized that copper in natural sunstone may have been introduced through diffusion after crystallization (Rossman, 2011). Because of the extraordinarily rapid diffusion rate of copper in feldspar crystals, the original copper distribution during crystal growth would be erased by diffusion during cooling. Some theoretical inward and outward diffusion profiles are illustrated in figure 16. With a long enough diffusion time, the two initially independent diffusion profiles from opposite surfaces (figure 16, A and D) would meet at the center of the crystal (figure 16, B and E), after which the profile would slowly approach a perfect sine function with decreasing amplitude (half a wavelength; figure 16C). The concentration profile of sample A314 (figure 14) and other Oregon sunstones with “watermelon” color is most certainly created by prolonged outward diffusion (figure 16E), starting from a more or less homogeneous copper concentration throughout the crystal. It should be noted that once the copper in the feldspar starts to precipitate as nanoparticles, they cannot move anymore, but can only grow by absorbing the copper dissolved in the feldspar lattice around it. This is why the copper profile of sample A314 in figure 14 follows a sine function (cyan curve) in the clear zone but deviates from it in the colored zones.
Using the diffusion coefficients of copper in plagioclase feldspar measured by Audétat et al. (2018), it can be roughly estimated that at least 100 days of outward diffusion at 1000°C are required to create the profile in sample A314. The real time to create the color zoning in sample A314 would be significantly longer, considering the time needed for copper to diffuse (or partition) into the feldspar crystal, as well as the significantly lower average temperature (and slower diffusion) during cooling. This is why the typical “watermelon” colors seen in figure 13, showing a wide clear zone near the entire surface of the stone and a red-colored core with schiller, have only been found in natural feldspar. It is likely that the extraordinarily strong pleochroism of sample SB-001 (figures 6, 9, and 12), indicating a higher aspect ratio of the copper particles, is also caused by slow cooling in natural basaltic lava flow.
In contrast, the copper profile of sample A110 indicates a complete inward diffusion of copper at high temperature (homogeneous copper concentration throughout the crystal) followed by a rapid cooling period, resulting in the precipitation of a small number of copper particles (color zones) and a very shallow outward diffusion profile near the surface (clear rim). This is the case for most artificially copper-diffused feldspars, with a concentration profile similar to the one in figure 16D. (The diffusion depth of sample A110 is comparable to the size of the laser beam and therefore not resolved in figure 14.) The copper particles would precipitate slightly later near the edge, which explains the “reverse-watermelon” color commonly observed in copper-treated feldspars with red rims outside green cores (McClure, 2009; Rossman, 2011). Rossman (2011) reported unusual “watermelon” color (red core and green rim; figure 15) in some artificially diffused feldspars, characterized by thin clear edges at the surface, often followed by thin red rims outside the green rings (similar to sample A110 in figure A-2, right), which are distinctively different from the natural “watermelon” Oregon sunstone. Incomplete inward diffusion (figure 16C) followed by rapid cooling (figure 16D), which would create a ring of peak copper concentration with less copper at both the core and the edge (figure 16F), may explain the color profile of the treated “watermelon” feldspars. The red core in sample A110 might be caused by the temperature or the oxygen fugacity gradient inside the crystal during copper diffusion and precipitation, since no obvious difference in copper concentration is detected relative to the green zone. Further study is needed to understand the detailed chemical reactions involved in the copper diffusion and exsolution processes. Schiller at the center of feldspar crystals (e.g., figures 5 and 15) has never been observed in artificially diffused feldspar, likely due to the much longer time it would take for the larger copper particles to form. Even if it were possible, producing these less desirable colors rather than vivid red and green colors would not be economically sound. Some copper-treated feldspars showing a pinkish sheen at the surface are probably the result of failed diffusion experiments.
CONCLUSIONS
This paper has described and discussed in detail the special color effects observed in Oregon sunstone (figure 17), including aventurescence (schiller), pleochroism, and color zoning. All the special optical effects of Oregon sunstone can be explained as combinations of the properties described here. The scattering power of the colloidal copper particles in Oregon sunstone is quantified for the first time. The strong scattering peak at ~625 nm agrees with the computed optical properties of copper nanoparticles in feldspar (Jin et al., 2022). The long axis of the particle is measured to be aligned along the a-axis in strongly pleochroic Oregon sunstones, which is expected from the weak connections along the (010) and (001) cleavage planes in the feldspar structure. To our knowledge, this is also the first time the anisotropic absorption (extinction) property has been quantified (oriented) in any triclinic mineral. The accurate orientation of the copper particles along with the optical indicatrix of the host feldspar would allow gem cutters to optimize the color and optical effects while faceting Oregon sunstones. The pleochroism in natural Oregon sunstone appears much stronger than in copper-treated feldspars, indicating higher aspect ratios of the copper particles, likely due to a slower cooling rate. More specimens need to be tested to confirm this as a universal characteristic of natural pleochroic Oregon sunstone, which could be used to identify natural stones without schiller. The concentration of copper in natural Oregon sunstones with “watermelon” color shows an outward diffusion profile that takes at least a few months (most likely years) to form, distinctly separating them from the artificially copper-diffused feldspars with no obvious correlation between color and copper content. The schiller at the core of the feldspar crystals, created by copper flakes a few micrometers in size or larger, has been found exclusively in natural stones. Further study on the dissolution and diffusion mechanisms of copper in feldspar is necessary to create a comprehensive method of separating treated copper-colored feldspars from natural ones.